

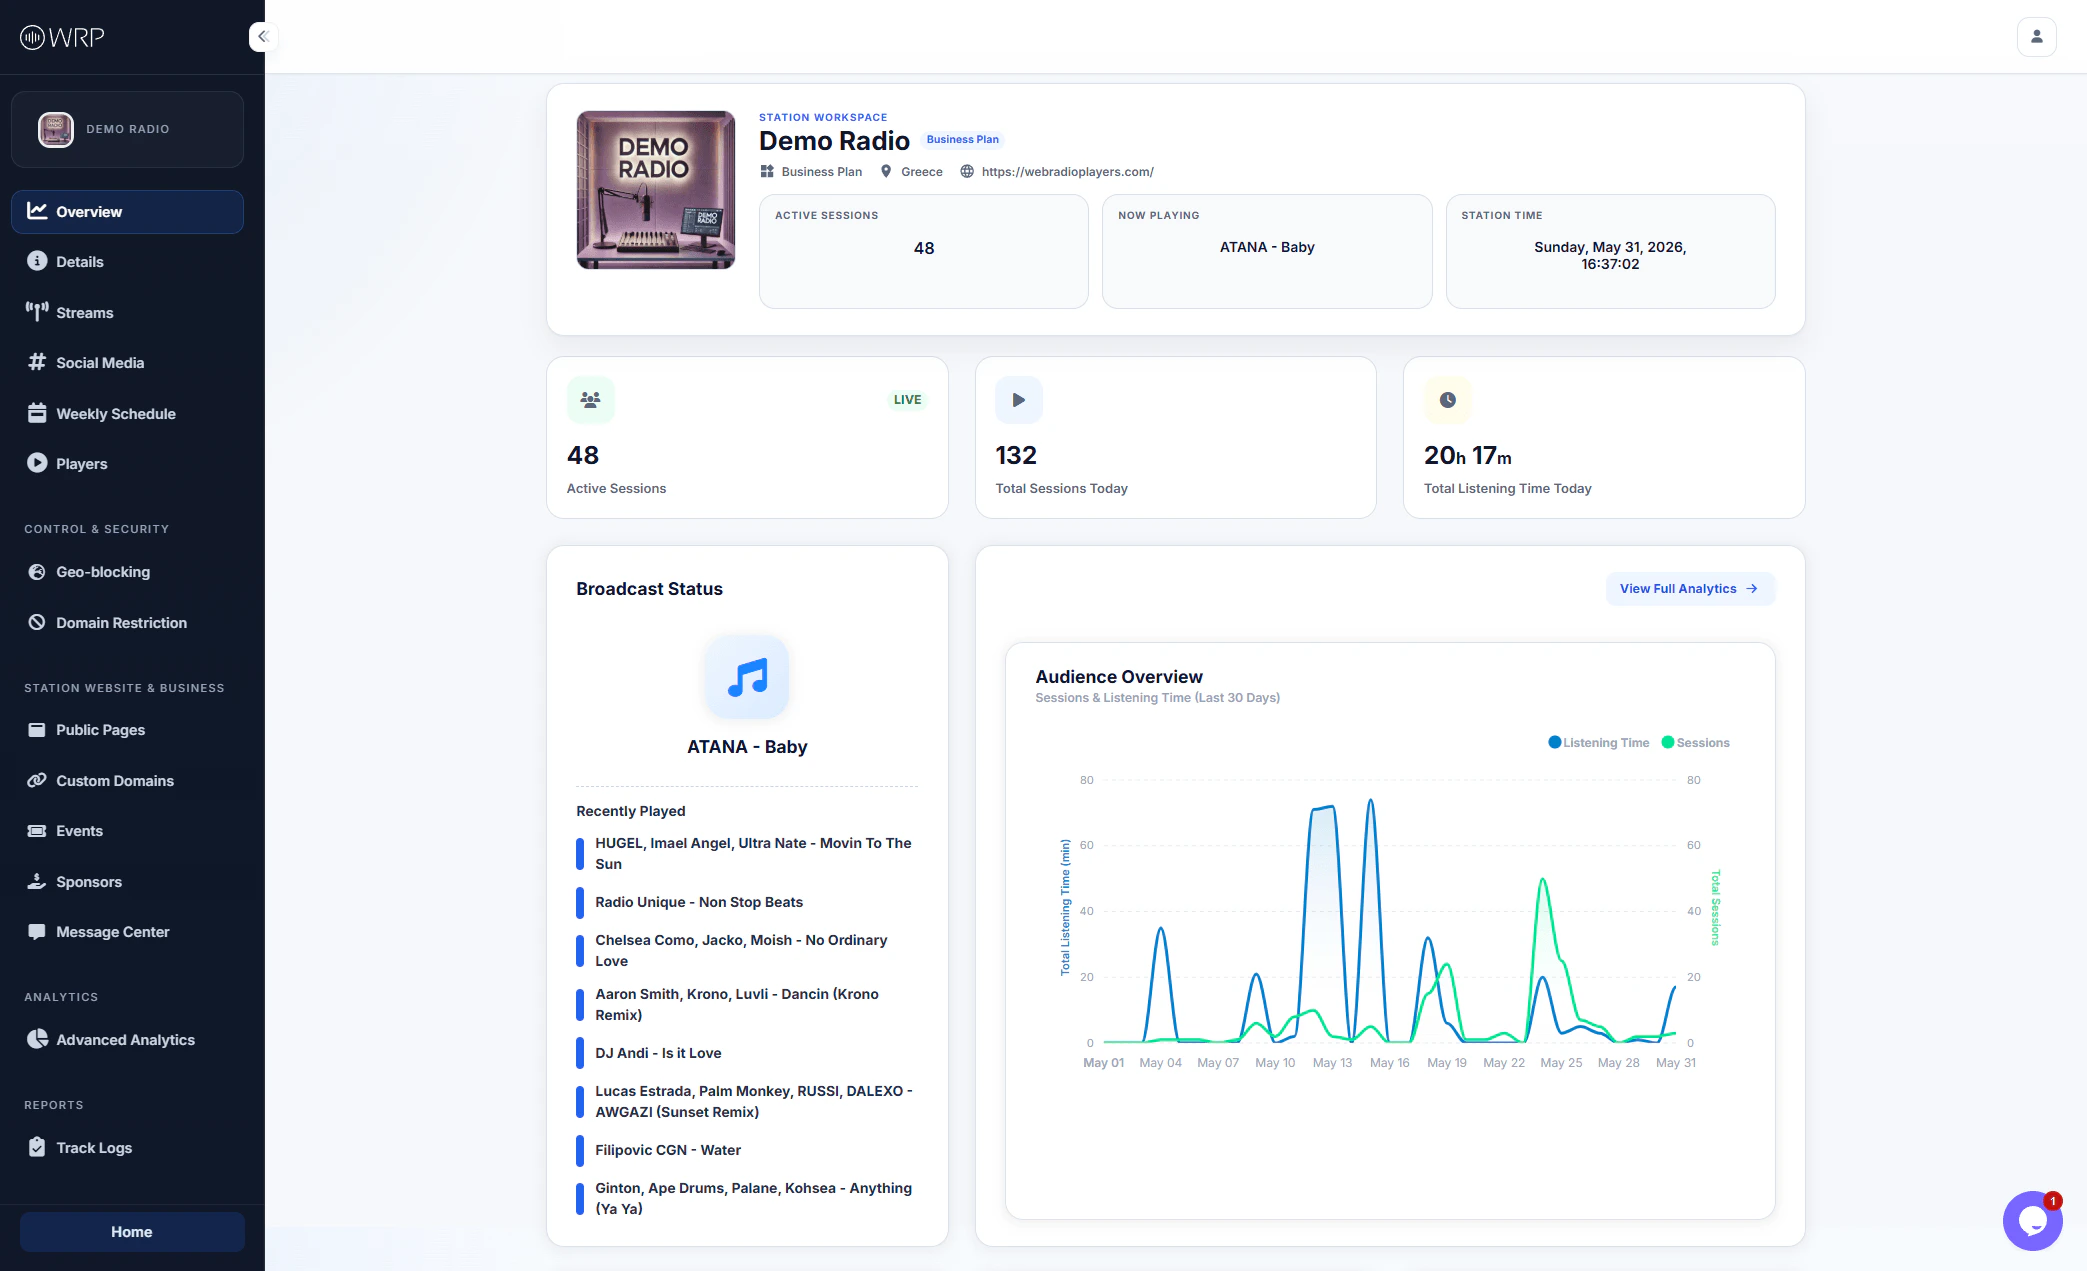
Real-Time Metrics
At the top of your dashboard, you will find key performance indicators (KPIs) that update in real time to show you exactly how your station is performing today:- Active Sessions: The exact number of listeners currently tuned in to your stream right now.
- Now Playing: The current track metadata being broadcasted to your listeners.
- Total Sessions Today: The cumulative number of times listeners have connected to your stream throughout the current day.
- Total Listening Time Today: The combined total hours and minutes your audience has spent listening today.
Pro Tip: Watch your Active Sessions during live shows or after a social media post to see the immediate impact of your marketing efforts!
Broadcast Status & History
The left column gives you immediate insight into what is being broadcasted to your audience:- Current Track: Displays a large music icon alongside the currently playing song (e.g., ATANA - Baby).
- Recently Played: A chronological log of the last several tracks played on your station. This is an excellent way to quickly verify that your stream’s metadata is being read and displayed correctly by the Web Radio Players platform.
Audience Overview (30-Day Trend)
The primary chart on the right provides a visual representation of your listener trends over the last 30 days.- Total Listening Time (Blue Line): Shows the daily volume of hours consumed by your audience.
- Total Sessions (Green Line): Shows the daily volume of individual connections made to your stream.