

Advanced Analytics
The Advanced Analytics dashboard visualizes your station’s performance over time. By understanding exactly who is listening, when they tune in, and how they connect, you can make data-driven decisions about your content and marketing.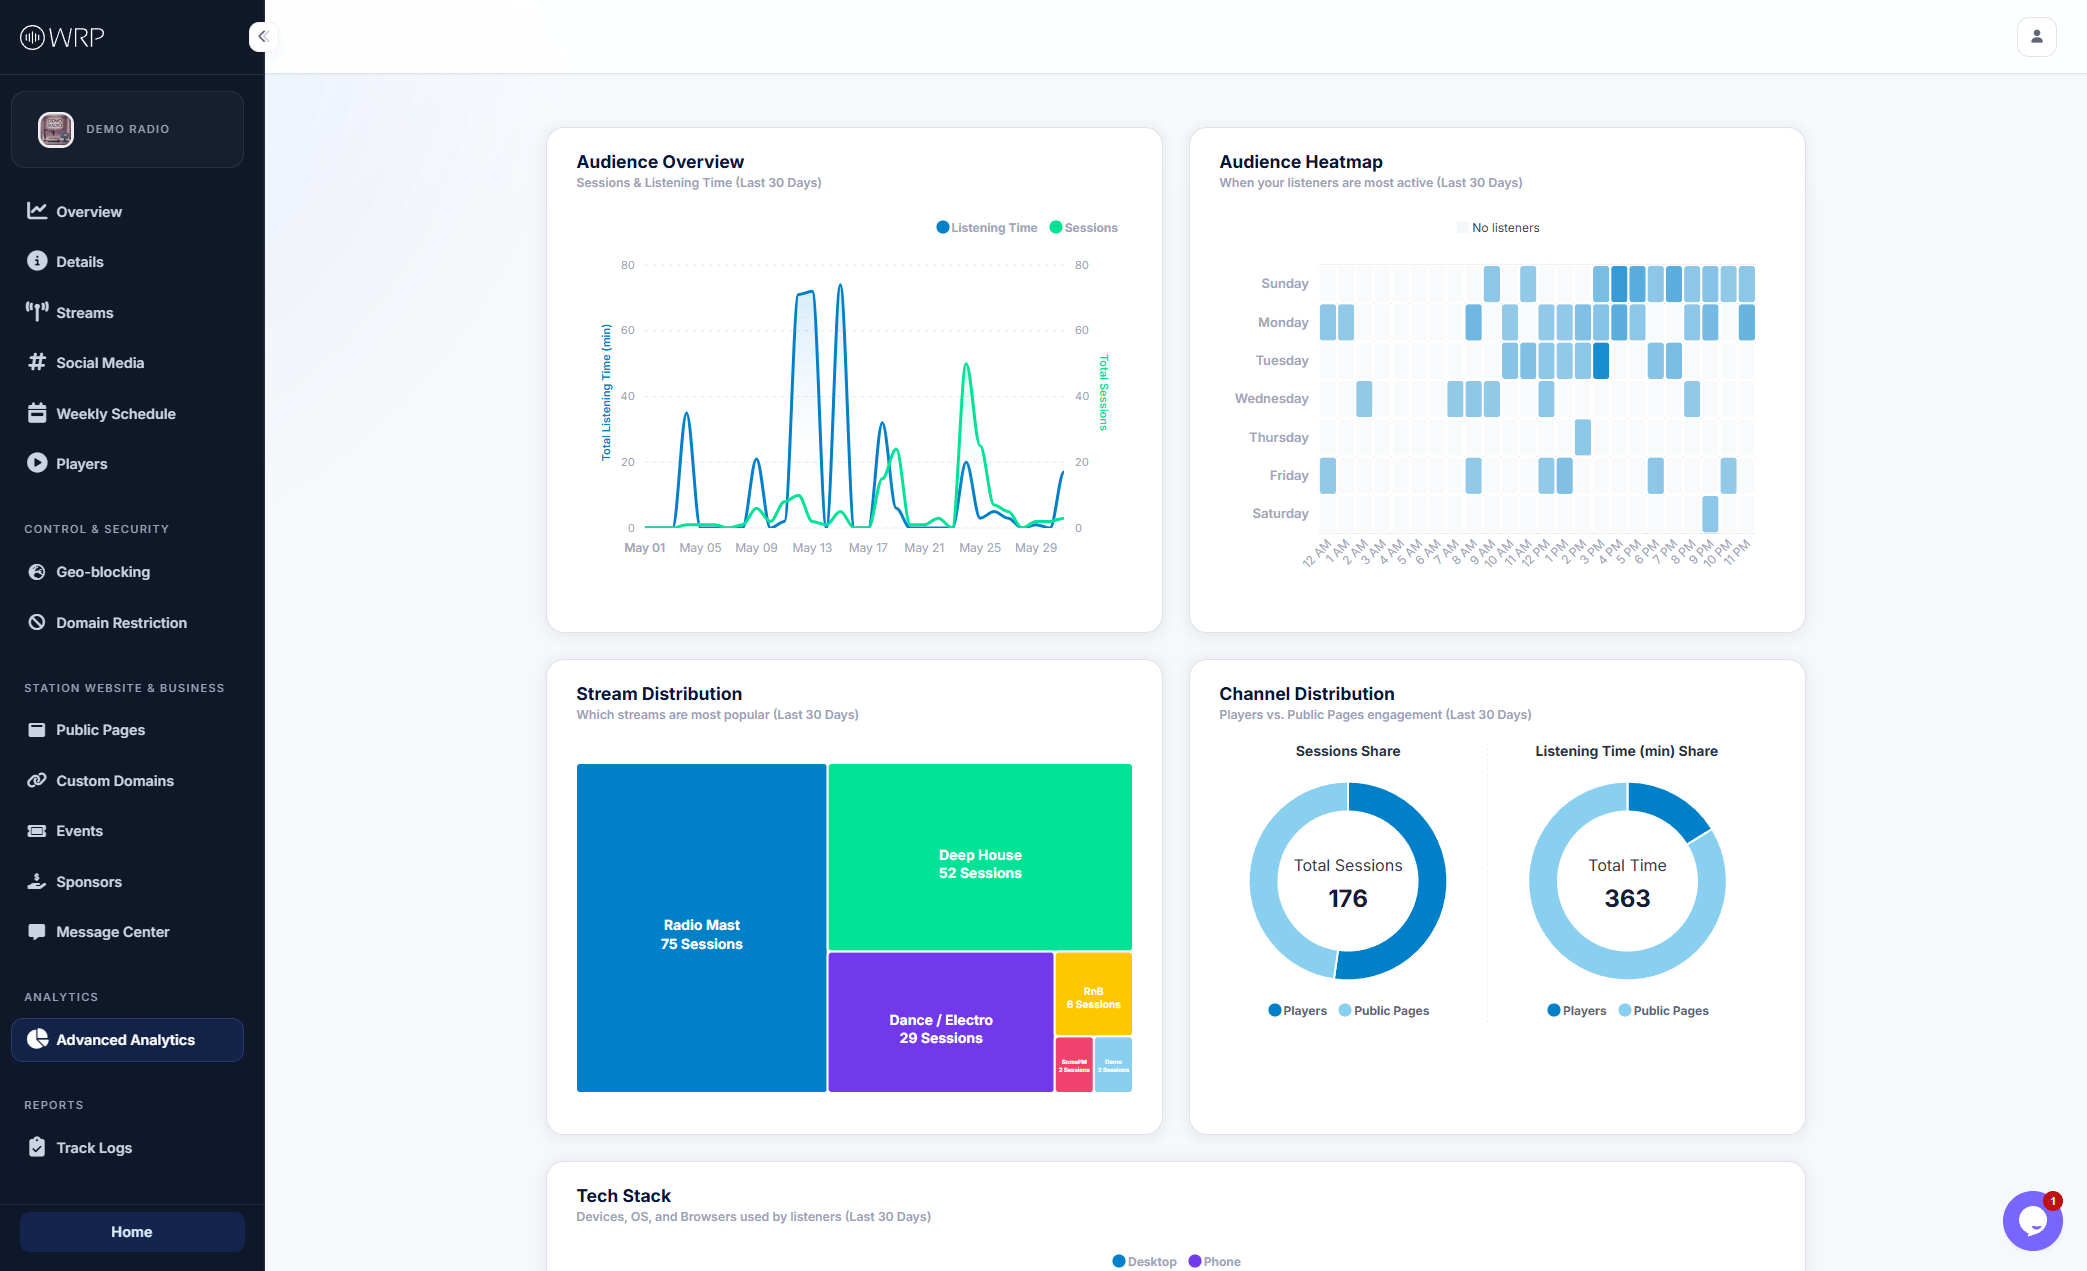
- Audience Heatmap: Discover exactly when your listeners are most active. This day-by-hour breakdown is perfect for deciding when to schedule your best shows or premium sponsor ads.
- Stream Distribution: If you broadcast multiple channels (e.g., Deep House vs. RnB), this chart shows you exactly which streams are the most popular.
- Channel Distribution: See where your traffic is coming from by comparing engagement between your embedded Web Players and your hosted Public Pages.
- Geographical Distribution: A breakdown of your listener base by country, helping you tailor your content or adjust your Geo-blocking rules.
- Tech Stack: Understand your audience’s hardware. This chart breaks down the Devices (Mobile vs. Desktop), Operating Systems, and Browsers your listeners use.
- Sponsor Analytics: Track the ROI of your advertising by viewing exactly which sponsor banners received clicks and when those interactions occurred.
Sponsorship Tip: You can use your Audience Heatmap and Sponsor Analytics charts as a “media kit” to prove your station’s value when pitching to potential advertisers!
Track Logs (Royalty Reporting)
If your station operates under a broadcasting license (such as SoundExchange, PPL, or ASCAP), you are likely required to submit periodic reports detailing exactly what music you played. The Track Logs tool eliminates the need for manual record-keeping by generating comprehensive export files in seconds.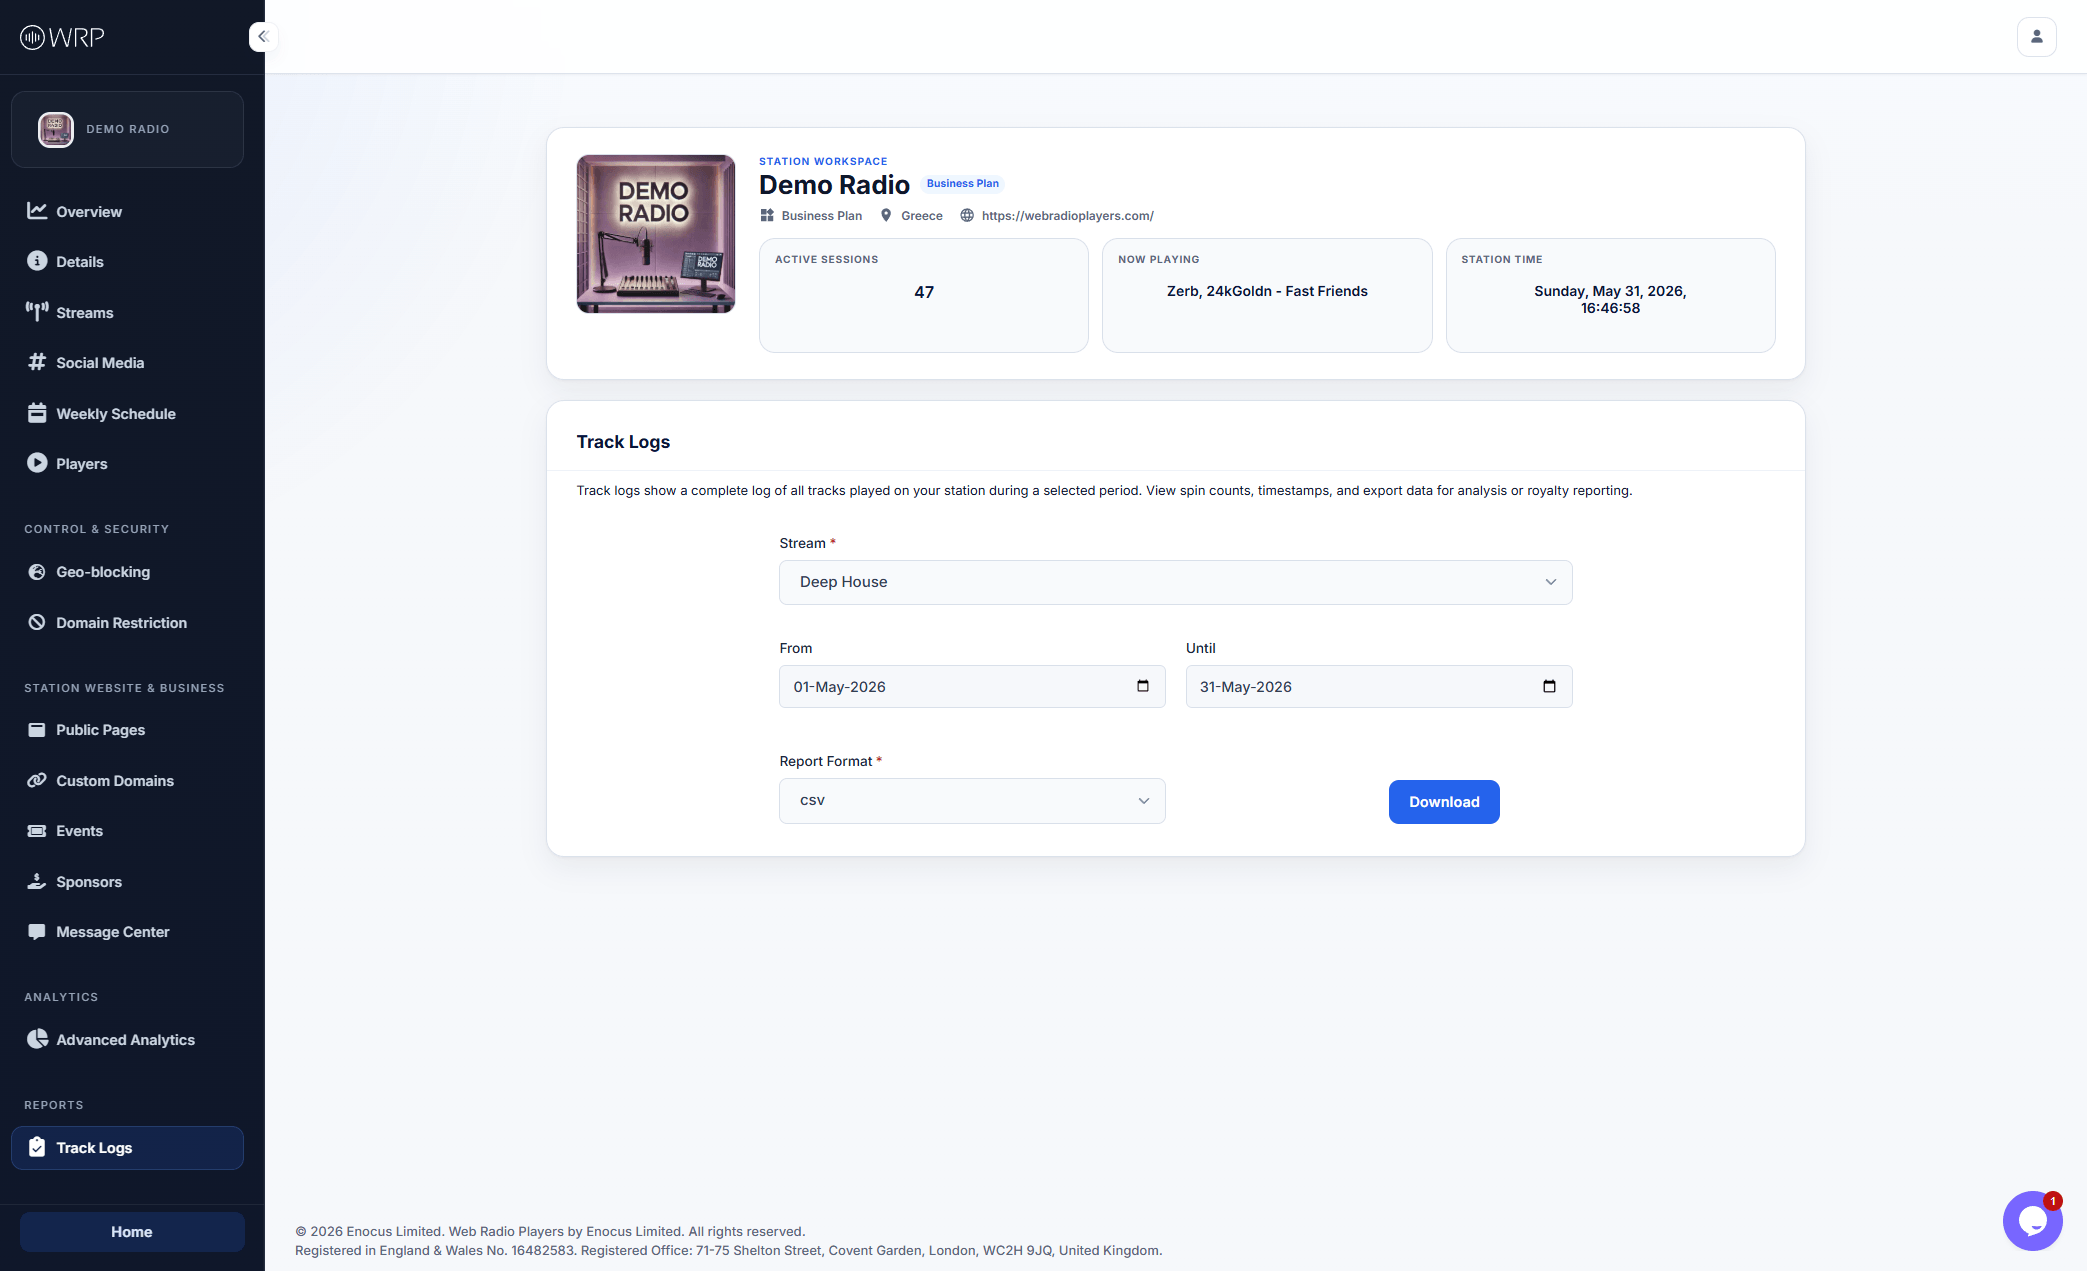
How to Export Your Logs
- Select a Stream: Choose which specific stream you need to generate a report for.
- Set the Date Range: Use the From and Until calendars to select your reporting period (e.g., a specific month or quarter).
- Choose the Format: Select either CSV (best for opening in Excel/Google Sheets) or JSON (best for API integrations or developer use).
- Download: Click the blue button to instantly generate your file.
Included Data Fields
To ensure full compliance with standard licensing authorities, your exported file automatically includes the following metadata for every single spin:- Artist Name
- Track Title
- Duration (Length of time the track was played)
- Started (UTC) (The exact global timestamp the track began)
- Started (Local) (The timestamp based on your station’s configured timezone)