> ## Documentation Index
> Fetch the complete documentation index at: https://docs.webradioplayers.com/llms.txt
> Use this file to discover all available pages before exploring further.
# Analytics & Logs
> Dive deep into your listener data, track sponsor engagement, and export your broadcast history for royalty reporting.
While the [Overview](/station/overview) page gives you a real-time snapshot of your station, the **Advanced Analytics** and **Track Logs** sections provide the historical data you need to grow your audience, optimize your programming, and stay compliant with licensing authorities.
## Advanced Analytics
The Advanced Analytics dashboard visualizes your station's performance over time. By understanding exactly *who* is listening, *when* they tune in, and *how* they connect, you can make data-driven decisions about your content and marketing.
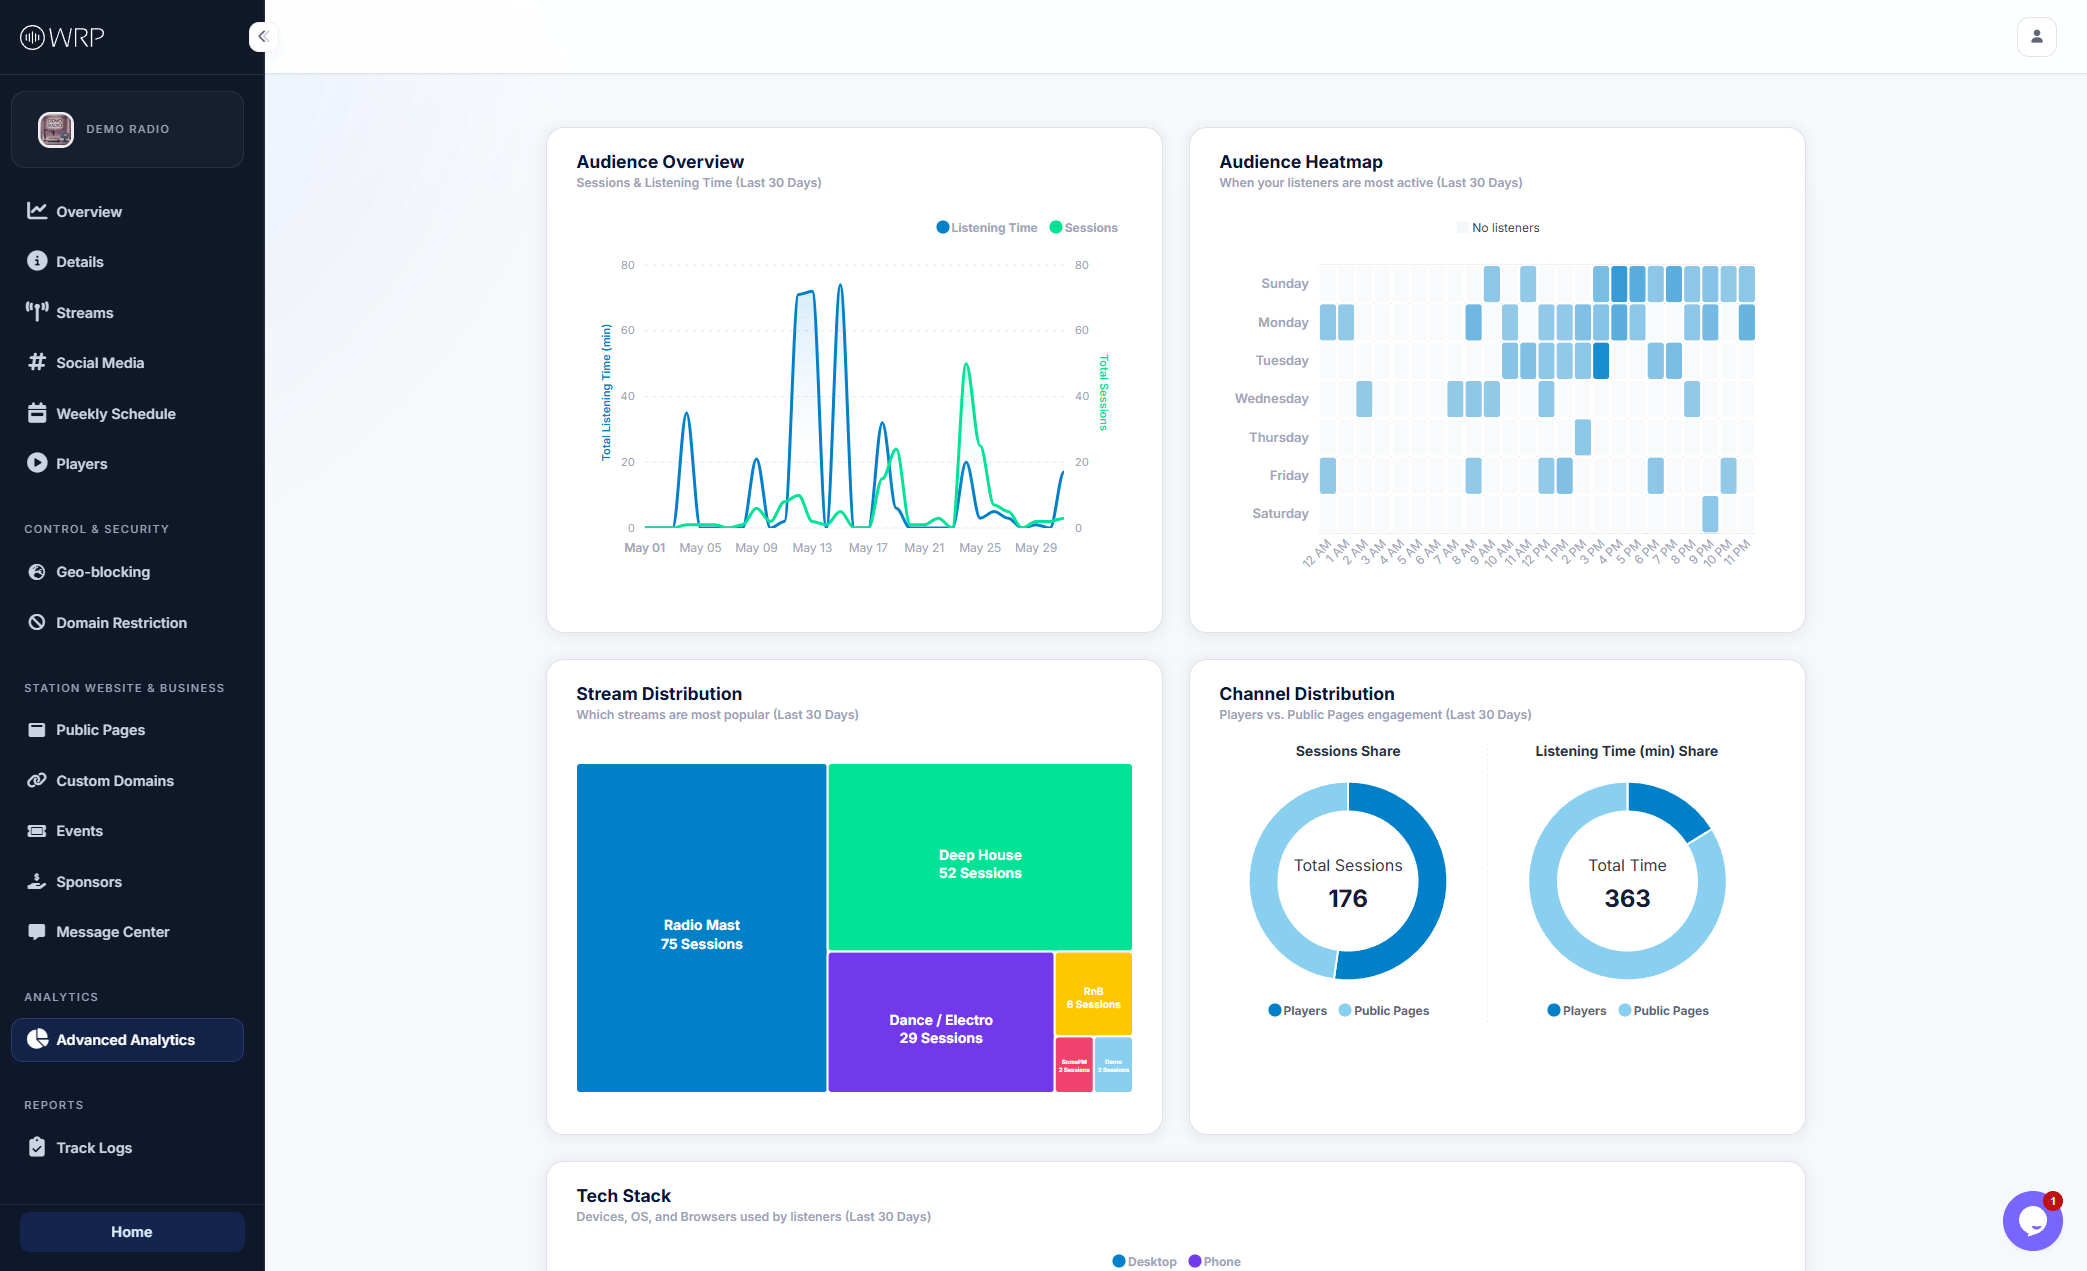 The dashboard includes a comprehensive suite of charts and metrics:
* **Audience Heatmap:** Discover exactly when your listeners are most active. This day-by-hour breakdown is perfect for deciding when to schedule your best shows or premium sponsor ads.
* **Stream Distribution:** If you broadcast multiple channels (e.g., *Deep House* vs. *RnB*), this chart shows you exactly which streams are the most popular.
* **Channel Distribution:** See where your traffic is coming from by comparing engagement between your embedded Web Players and your hosted Public Pages.
* **Geographical Distribution:** A breakdown of your listener base by country, helping you tailor your content or adjust your Geo-blocking rules.
* **Tech Stack:** Understand your audience's hardware. This chart breaks down the Devices (Mobile vs. Desktop), Operating Systems, and Browsers your listeners use.
* **Sponsor Analytics:** Track the ROI of your advertising by viewing exactly which sponsor banners received clicks and when those interactions occurred.
**Sponsorship Tip:** You can use your Audience Heatmap and Sponsor Analytics charts as a "media kit" to prove your station's value when pitching to potential advertisers!
***
## Track Logs (Royalty Reporting)
If your station operates under a broadcasting license (such as SoundExchange, PPL, or ASCAP), you are likely required to submit periodic reports detailing exactly what music you played.
The **Track Logs** tool eliminates the need for manual record-keeping by generating comprehensive export files in seconds.
The dashboard includes a comprehensive suite of charts and metrics:
* **Audience Heatmap:** Discover exactly when your listeners are most active. This day-by-hour breakdown is perfect for deciding when to schedule your best shows or premium sponsor ads.
* **Stream Distribution:** If you broadcast multiple channels (e.g., *Deep House* vs. *RnB*), this chart shows you exactly which streams are the most popular.
* **Channel Distribution:** See where your traffic is coming from by comparing engagement between your embedded Web Players and your hosted Public Pages.
* **Geographical Distribution:** A breakdown of your listener base by country, helping you tailor your content or adjust your Geo-blocking rules.
* **Tech Stack:** Understand your audience's hardware. This chart breaks down the Devices (Mobile vs. Desktop), Operating Systems, and Browsers your listeners use.
* **Sponsor Analytics:** Track the ROI of your advertising by viewing exactly which sponsor banners received clicks and when those interactions occurred.
**Sponsorship Tip:** You can use your Audience Heatmap and Sponsor Analytics charts as a "media kit" to prove your station's value when pitching to potential advertisers!
***
## Track Logs (Royalty Reporting)
If your station operates under a broadcasting license (such as SoundExchange, PPL, or ASCAP), you are likely required to submit periodic reports detailing exactly what music you played.
The **Track Logs** tool eliminates the need for manual record-keeping by generating comprehensive export files in seconds.
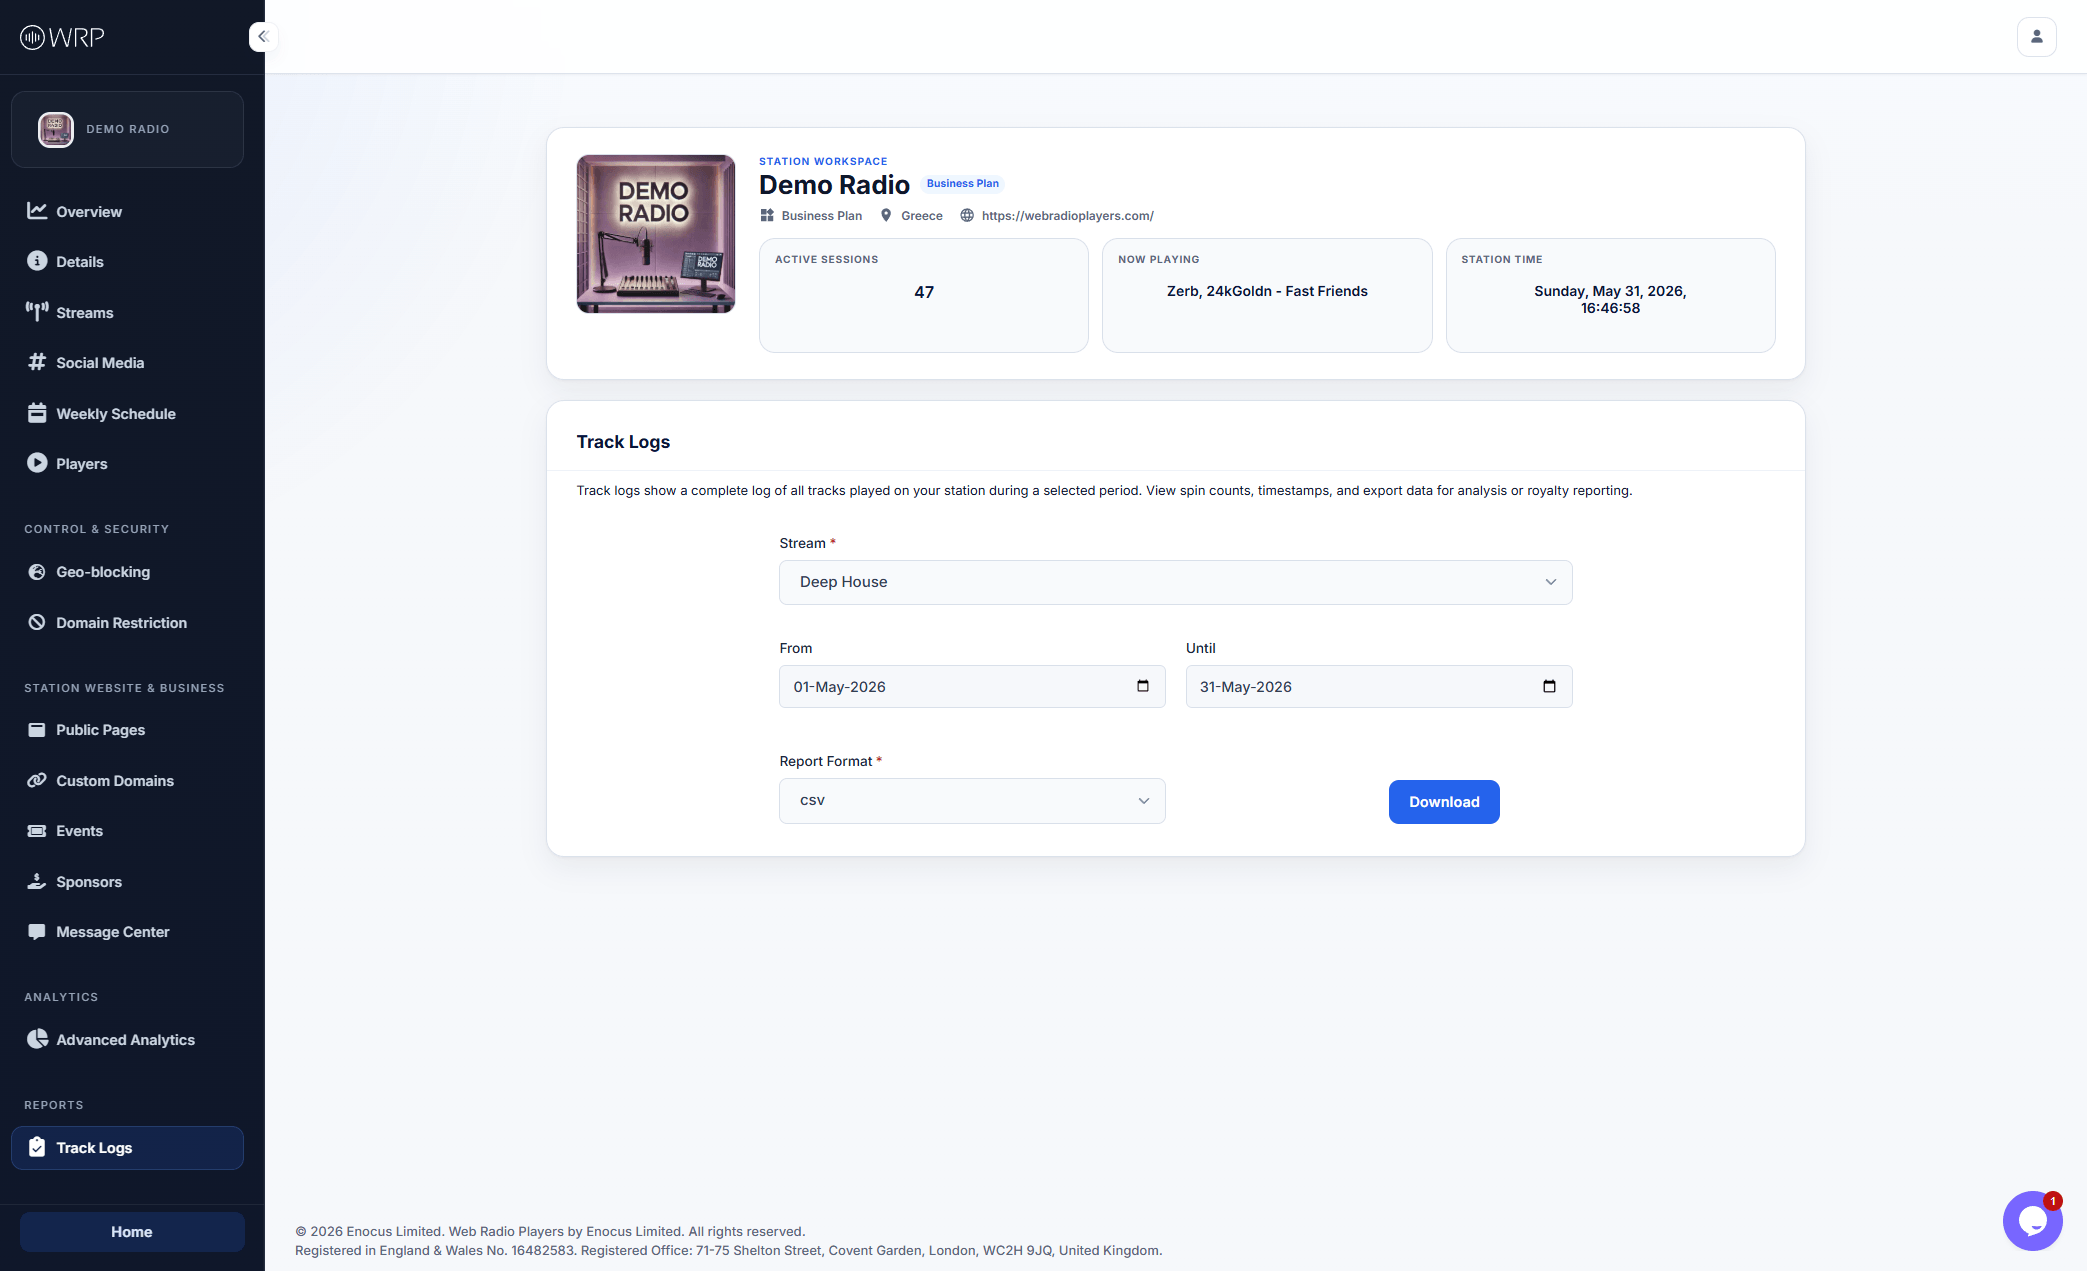 ### How to Export Your Logs
1. **Select a Stream:** Choose which specific stream you need to generate a report for.
2. **Set the Date Range:** Use the **From** and **Until** calendars to select your reporting period (e.g., a specific month or quarter).
3. **Choose the Format:** Select either **CSV** (best for opening in Excel/Google Sheets) or **JSON** (best for API integrations or developer use).
4. **Download:** Click the blue button to instantly generate your file.
### Included Data Fields
To ensure full compliance with standard licensing authorities, your exported file automatically includes the following metadata for every single spin:
* **Artist Name**
* **Track Title**
* **Duration** (Length of time the track was played)
* **Started (UTC)** (The exact global timestamp the track began)
* **Started (Local)** (The timestamp based on your station's configured timezone)
### How to Export Your Logs
1. **Select a Stream:** Choose which specific stream you need to generate a report for.
2. **Set the Date Range:** Use the **From** and **Until** calendars to select your reporting period (e.g., a specific month or quarter).
3. **Choose the Format:** Select either **CSV** (best for opening in Excel/Google Sheets) or **JSON** (best for API integrations or developer use).
4. **Download:** Click the blue button to instantly generate your file.
### Included Data Fields
To ensure full compliance with standard licensing authorities, your exported file automatically includes the following metadata for every single spin:
* **Artist Name**
* **Track Title**
* **Duration** (Length of time the track was played)
* **Started (UTC)** (The exact global timestamp the track began)
* **Started (Local)** (The timestamp based on your station's configured timezone)